Simply send an email to info@databek.de to receive your access credentials and test either platform free for 14 days.
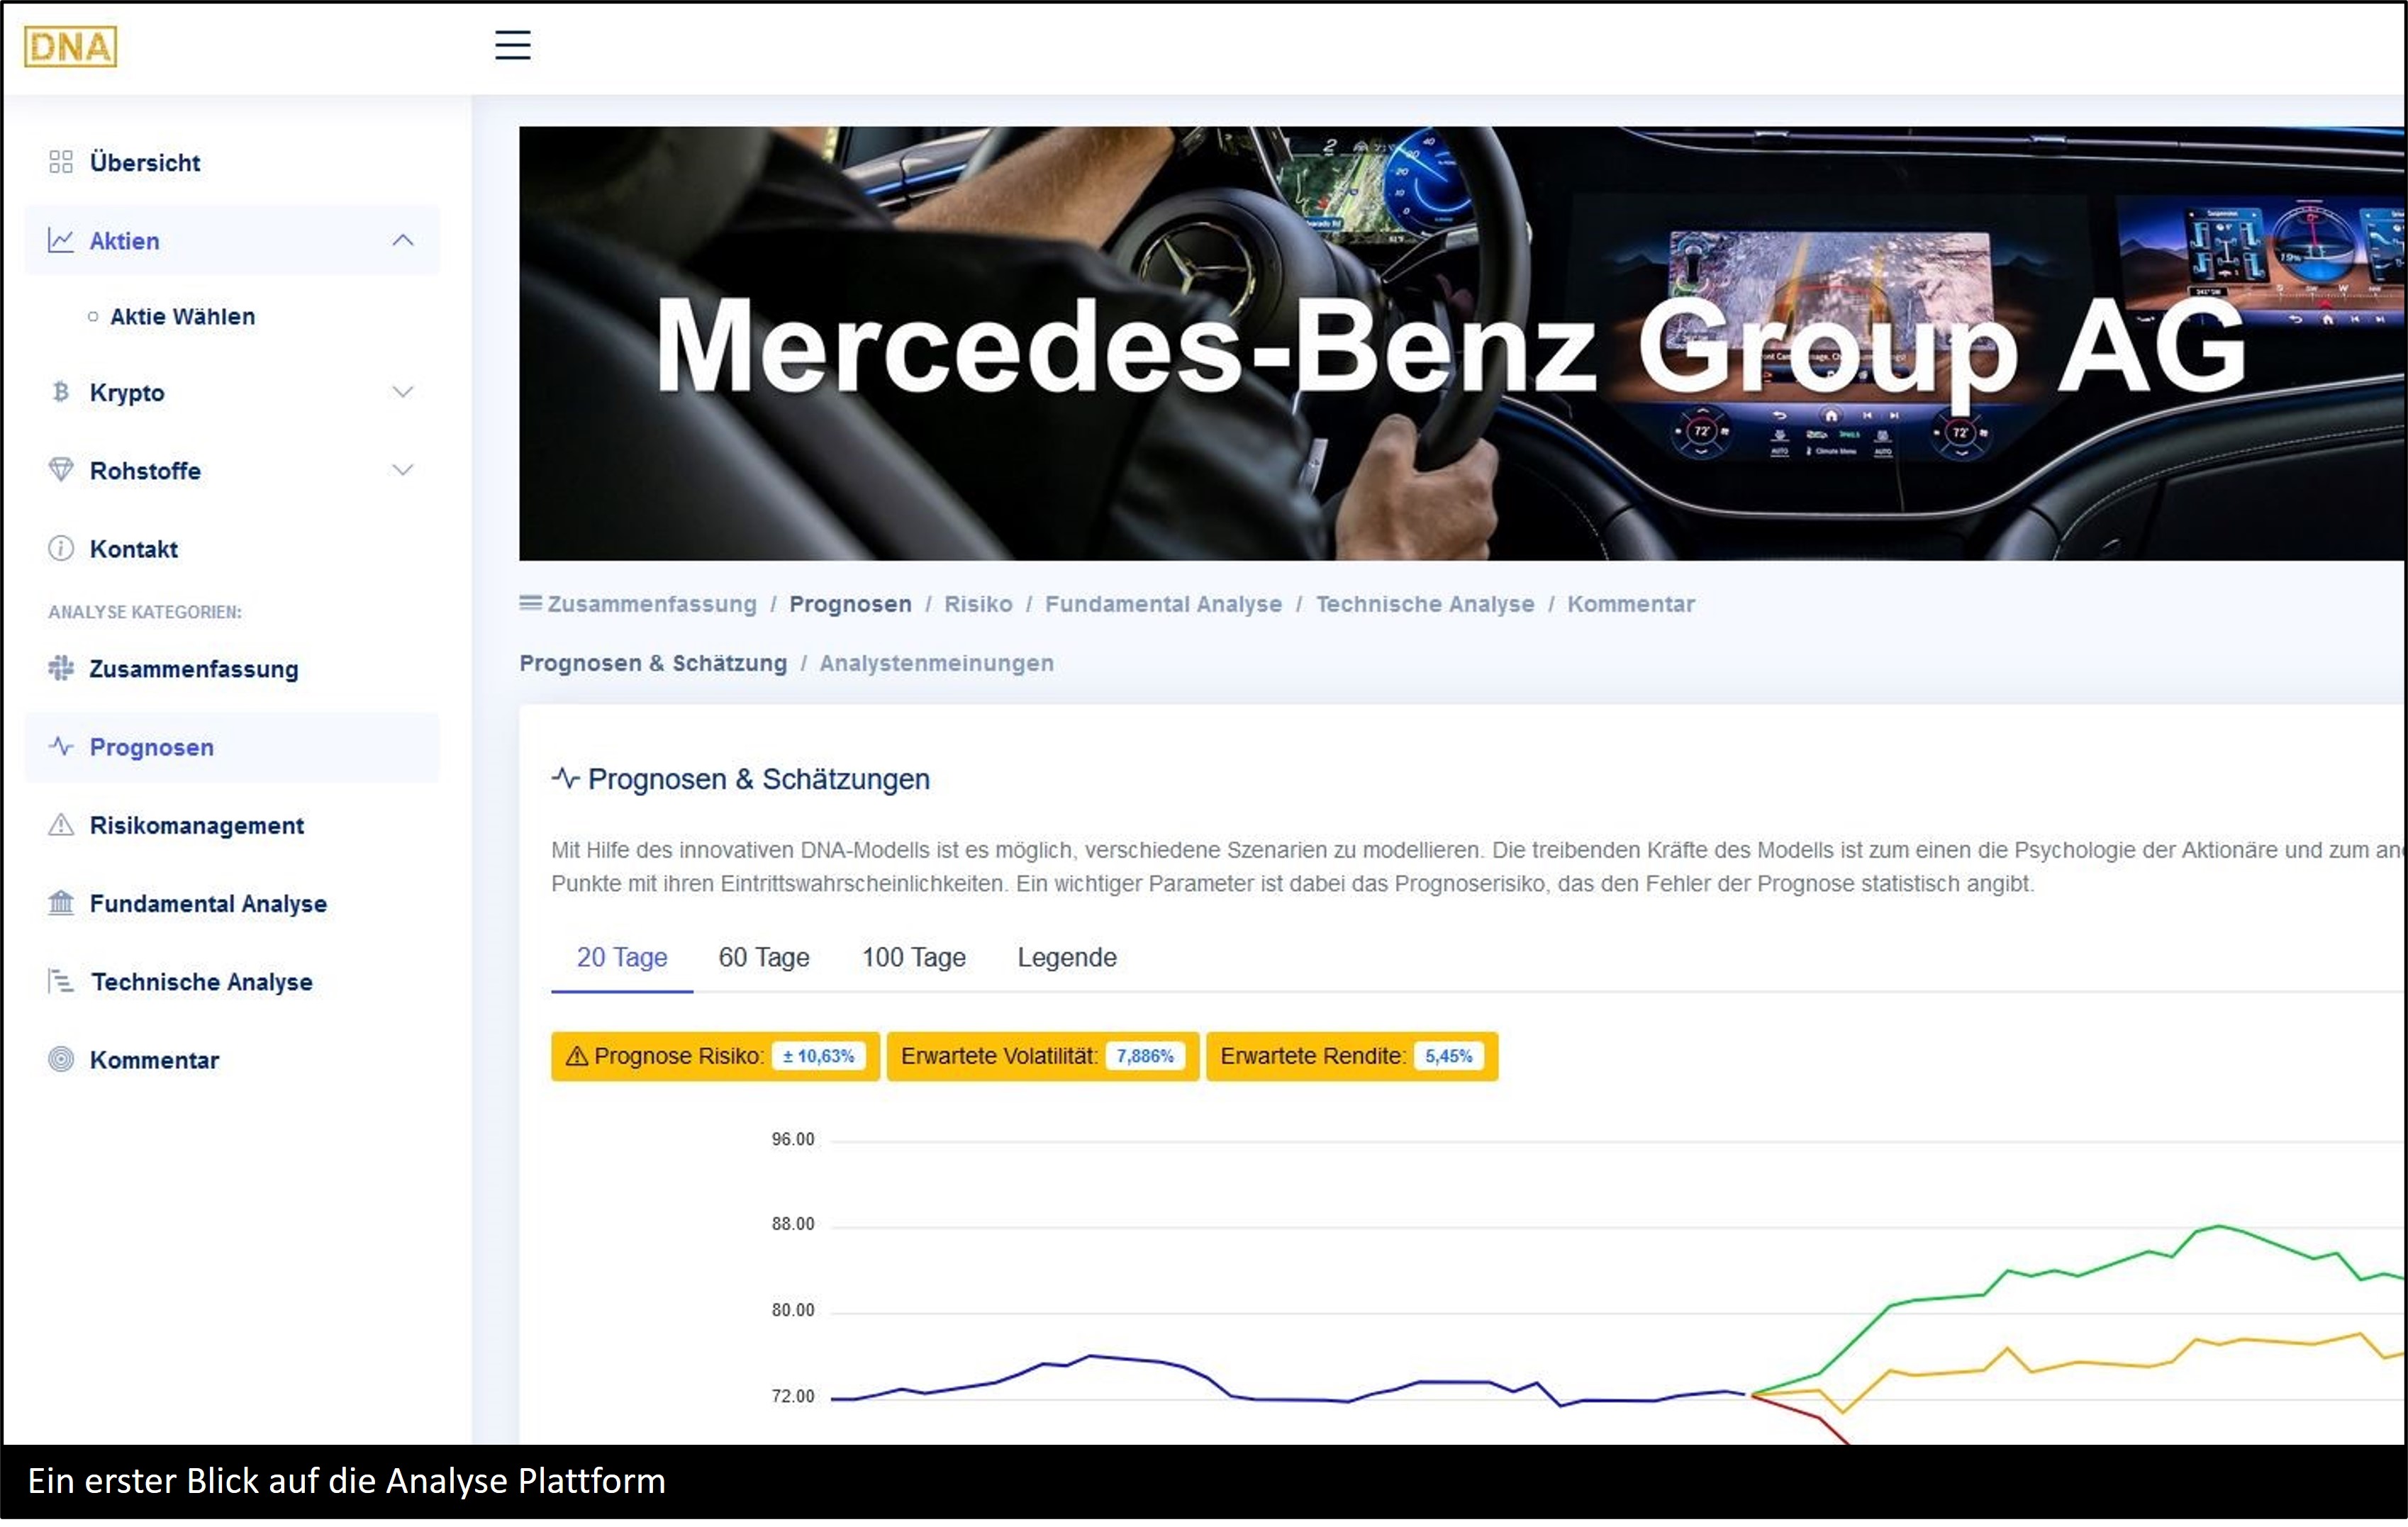
Analysis Platform
Stocks, Cryptos & Commodities
On our analysis platform, we provide detailed analyses for all stocks in our continually growing pool. Whether it's forecasts, financial figures, or predictions using our innovative method – everything is compact and accessible with just a few clicks to facilitate successful investment. Visit www.aktiendna.de to preview this platform with explicit examples.
Price: Monthly €44.90
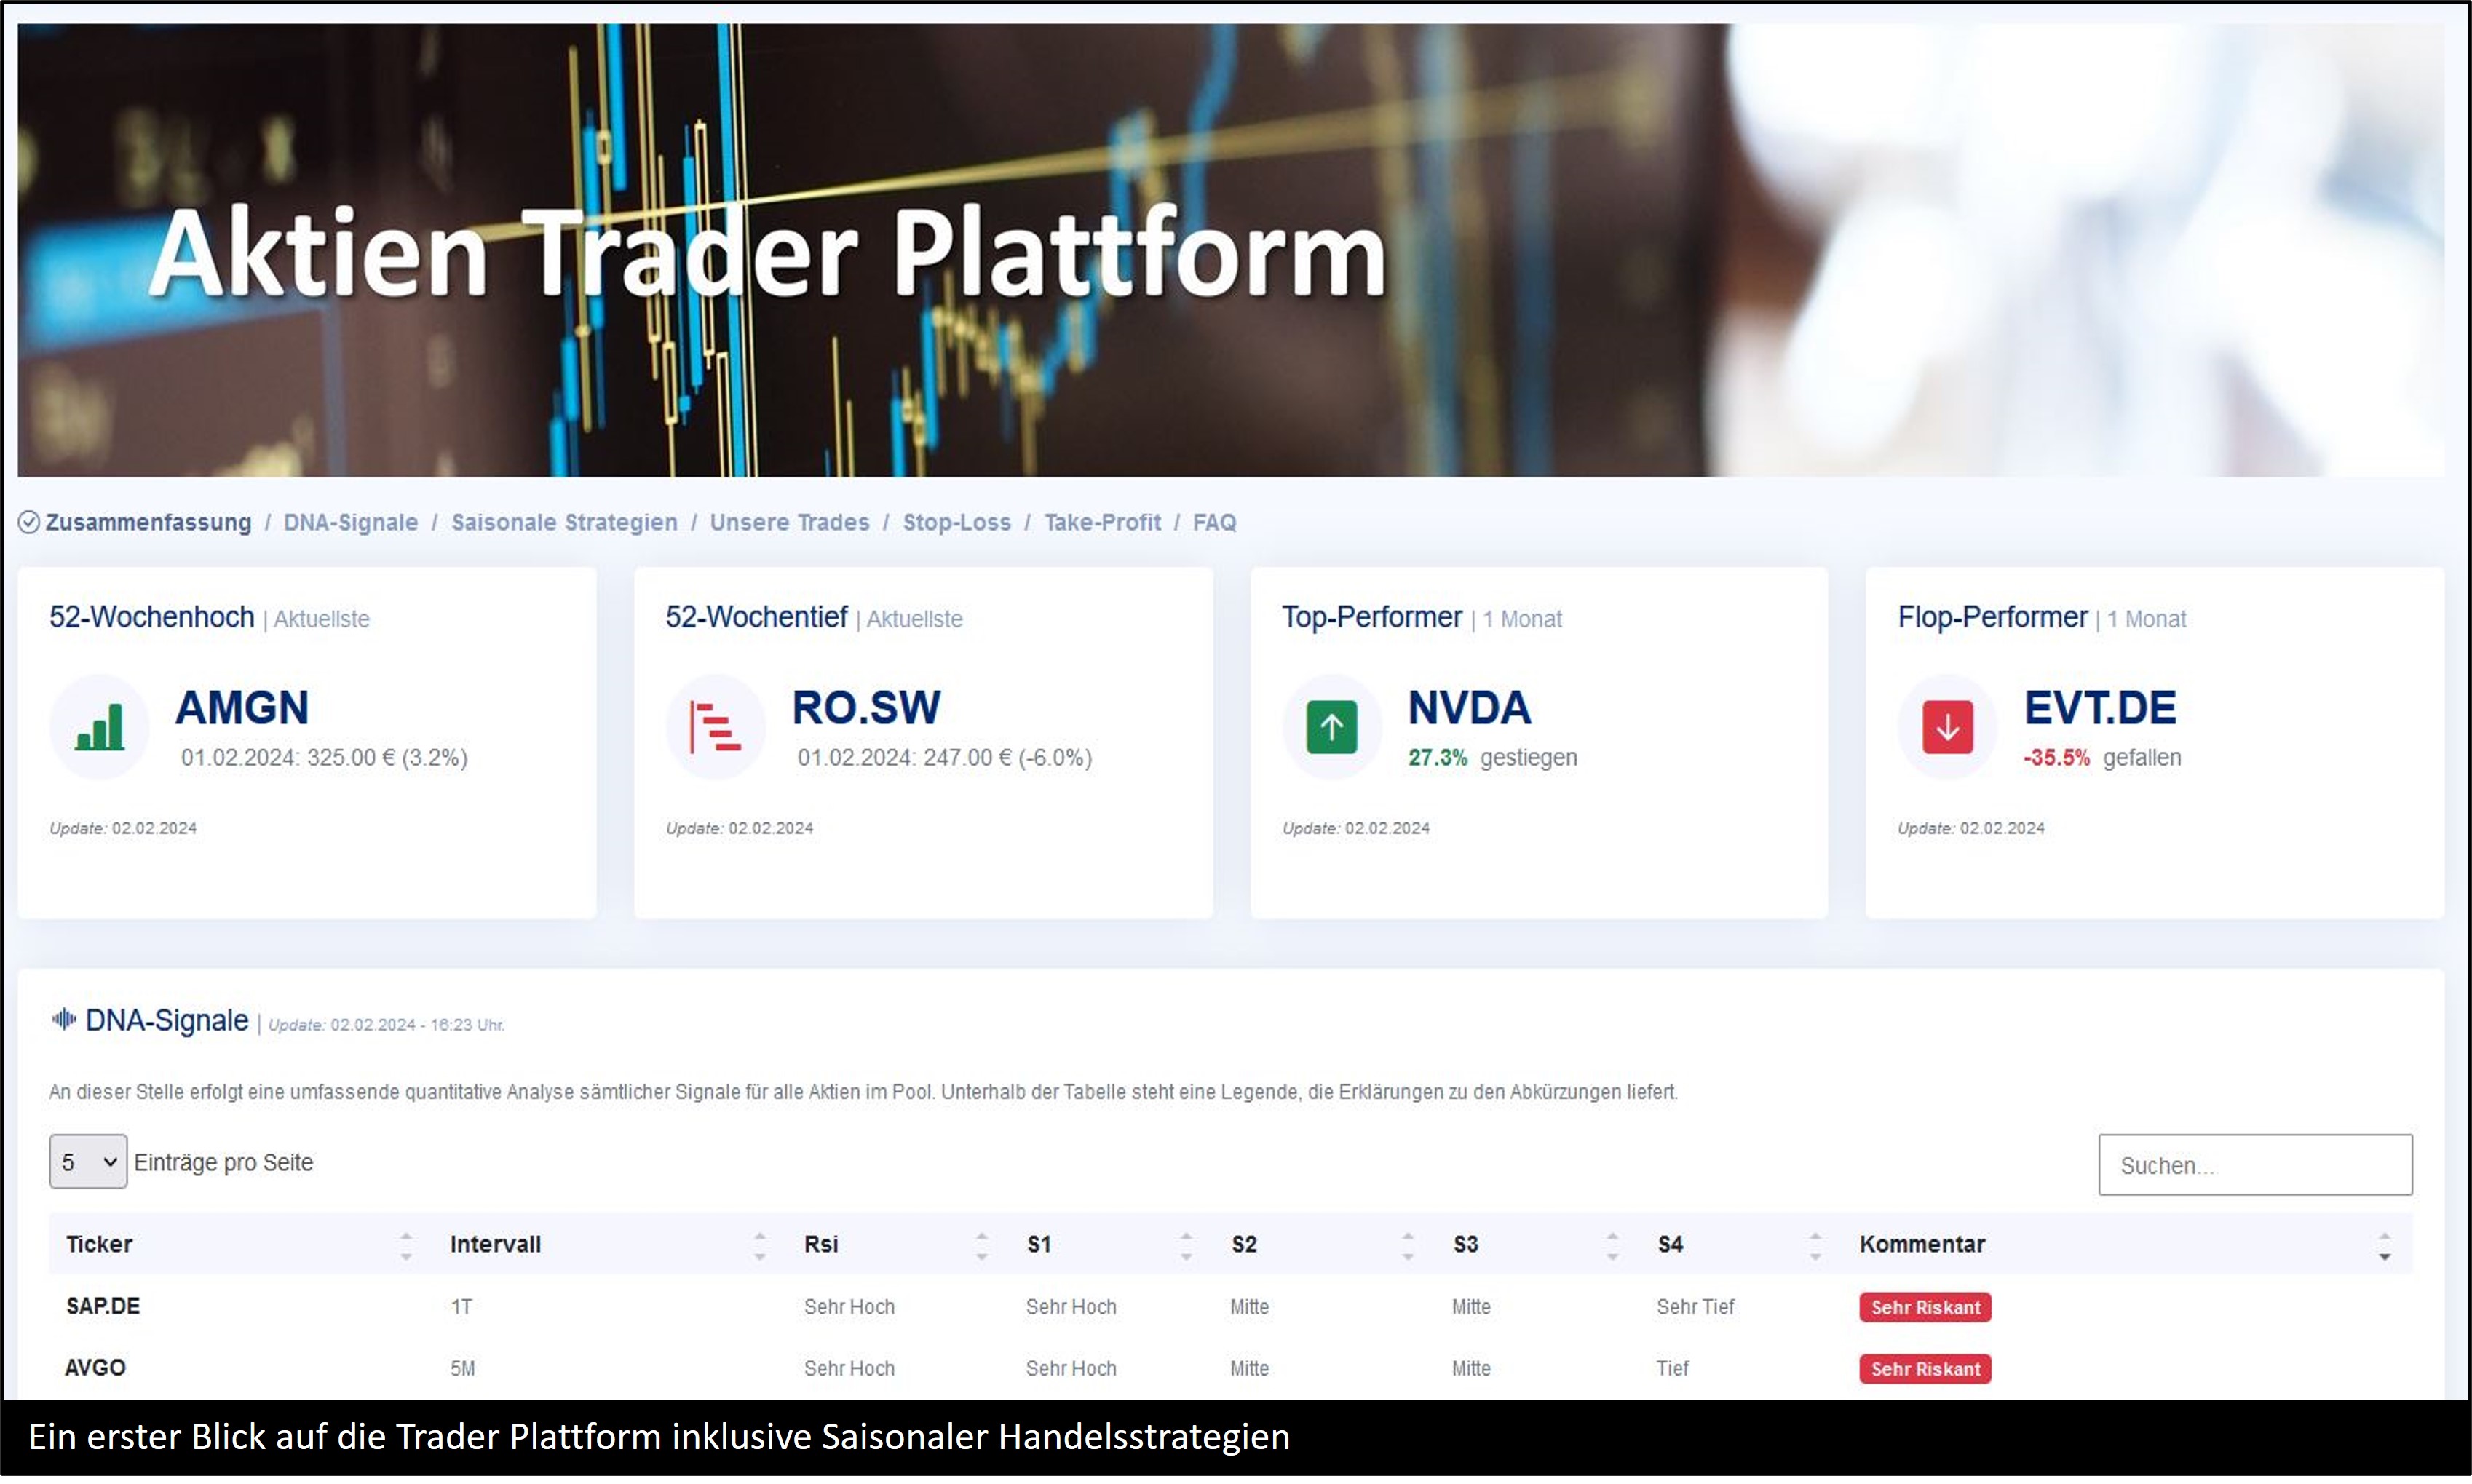
Trader Platform
Trading Signals for Forecasts
The trader platform not only provides precise signals for stocks from our pool for successful positions but also intelligently summarizes the essential points in a clear table. Additionally, you will receive clear stop-loss and take-profit limits that you can use for your trades. Furthermore, you'll find a table with seasonal effects that are significant for long-term trades. More info on www.aktiendna.de
Price: Monthly €69.90
Why Us?
We take pride in our innovative mathematical model, DNA of a stock, which enables precise analysis of stocks, cryptocurrencies, and commodities. Through its application, we achieve exceptionally high accuracy rates in forecasts. Our unique approach combines solid research, advanced data analysis, and proven mathematical algorithms for accurate insights and recommendations in the stock market.
The result of years of experience and continuous development allows us to analyze comprehensive data, identify market trends, and predict future developments. Our innovative technology provides a solid foundation for decision-making to help you identify the best investment opportunities.
The impressive results of our mathematical model form the foundation of our commitment to providing you with real value. Our goal is to optimize your portfolio and maximize profits. Clients trust our expertise, appreciate the reliability of our analyses, and gain a competitive advantage in financial markets.
Frequently Asked Questions
Is the Trader Platform not too expensive?
For investors who invest smaller amounts, this may initially seem significant. However, if you make successful trades and investments through the platform, and thus actually make profits, the platform becomes cost-free as you can finance it from your gains. Therefore, we offer you the opportunity to test the platform for free for 14 days. During this trial period, you can check whether you can trade profitably. For professional traders, the amount is negligible compared to the profits generated using this platform.
How can I have my stock portfolio evaluated?
Simply send us a copy of your portfolio as a CSV or Excel file via email. Due to the General Data Protection Regulation (GDPR), no personal data should be present in this file. Please make sure to delete your personal data (such as names or account numbers) from this file. If you do not want to go through this effort, a short declaration of consent in advance is sufficient, allowing us to analyze your data.
How can I build a portfolio?
Depending on your preferences and goals, we show you analysis results of several stocks, the detailed results of which you can inspect yourself. You can then freely decide which stocks are suitable for you as an investment. Furthermore, we always have optimized examples of portfolios generated from our current analyses. If this matches your profile and strategy, you can quickly build a portfolio. We do not make specific recommendations for individual securities or portfolios, as our analysis results depend on various factors (optimistic, expected, and pessimistic), and each investor must assess them for themselves. You always make your decisions. We are also happy to assist you in opening an account and in setting up individual positions. We accompany you in your investment and provide updated suggestions for optimization if adjustments are necessary. For this, we also create individual programs/tools for you, which warn you about current dangers or make new suggestions for stop-loss limits.
I already have candidates for my portfolio but don't know how many of each stock to buy. What would be the best or optimal distribution?
If you already have a selection and want to invest in these stocks (or in general in any asset classes), we can initially help you with an individual personality analysis and with our individual stock analyses, simulating various scenarios and obtaining a ranking for these stocks. Then, on the one hand, you can compare these individual stocks in terms of profit and risk expectation and see if they also match your character. Finally, with the help of our DNA algorithm, we can create a portfolio, the distribution of which can be calculated concretely depending on liquidity. We simulate all possible distributions and select the best one in terms of maximum profit expectation and minimum risk expectation from these.
I am already invested in stocks and am in profit in some positions. I want to take part of the profit but don't know how much to sell? (Analog: Positions with a loss)
If you sell all stocks and take the entire profit, there is a risk that further profits will be missed if the price continues to rise. On the other hand, if you don't sell anything and the price goes down, you lose your profit. Therefore, it is crucial to consider the optimal balance or equilibrium in these stocks but also in the entire portfolio. We calculate specific values for this balance with the help of individual stock analyses. We also look at the overall performance of the portfolio and individual positions as well as the history using order and transaction data. You will then receive concrete suggestions with individual justifications or statements that you can easily assess at your discretion and choose one of the suggestions. We show you all positive and negative aspects so that you have an overarching perspective and can make the best decision.
Analog:
We do the same for positions where you are in loss/negative. Then the question arises whether to sell these stocks completely or partially, wait, or buy more. On the one hand, selling these stocks in the negative minimizes my loss and avoids further losses if the price continues to drop. On the other hand, if you don't sell anything, and the price goes up again, you reduce your loss or even go into profit. The procedure is the same as above. Individual stock analyses and an analysis of the balance in the portfolio enable us to make specific suggestions with pros and cons.
Can I understand the results of your analyses?
Yes. The statistical results and forecasts of the DNA algorithm are simplified for end-users to understand and apply without prior knowledge. We support you with user-friendly dashboards, with the help of which you can also independently examine individual relationships.
What if your predictions are wrong? Do you have concrete examples?
Our predictions, such as the future price development of a security, always include a margin of error. This means that these simulated values for the future can occur with high probability. BUT a 100% probability can usually never be given. Especially for longer periods, error estimates increase. Therefore, you will always see at least three different scenarios (optimistic, pessimistic, and expected), whose error limits we specify. These scenarios, which depend on relevant factors (e.g., politics, law, macroeconomic expectations, etc.), develop accordingly. For example, the algorithm develops the price in the optimistic scenario in such a way that all relevant factors are positive. This applies analogously to the pessimistic case. The expected value simulates the future assuming that nothing extraordinary will happen. We briefly and concisely specify these relevant factors, which we identify through correlation analyzes. Therefore, you can also weigh which scenario is the most realistic at your discretion. You can then make your investment decisions based on this and not blindly invest in any asset classes.
Here is a concrete example of a forecast from a one-pager for the Georg Fischer stock, which we created on 26.05.2022 and sent to several managers in the finance industry at that time. The forecast was made for the next 100 days in the future with the predicted and expected target price of 51.99 CHF for 02.09.2022, which was shown in black. We are very pleased that the algorithm described the real price development (in orange) within a very good range.


What is the DNA of a stock?
The DNA of a stock is a chain of elements that we denote as A, T, G, C. This chain of elements describes the quantitative behavior of the price of a stock, with each element having certain information, and the order of these elements is not arbitrary. An example of a short chain could look like this: ATGCAAAAGCGATGCTGACA. This gives us an improved analysis and forecast.
On which securities or asset classes can the DNA method be applied to make statements about development?
The method can be applied to all securities and asset classes as long as you have the corresponding price data. In particular, for stocks, commodities, ETFs, indices, funds, and cryptocurrencies, the algorithm can provide results.
Is the DNA of a stock to be equated with the DNA of a company?
No. The DNA of a stock describes the behavior of buyers and sellers of a stock and is a completely new and innovative way of looking at a stock of a company!
How can one see or analyze the psychology of the market in the DNA chain?
The price of a stock arises depending on how many participants want to sell or buy. Each trader (according to John Nash: player) has a certain interest, strategy, or intention when participating in the market. The psychology of the market, i.e., the emotions of the participants, can now be recognized in this DNA chain, especially after sequencing, that is, in parts of this DNA chain. Emotions but also irrational behavior correspond to certain subchains in the DNA. A systematic analysis of the entire DNA of the stock allows determining the character of a stock.

Can this principle of the DNA chain be applied outside the financial world and generate added value?
Yes. In particular, the buying behavior of customers can be described with the help of a DNA chain. As part of data analysis (Customer Analytics), DNA helps to achieve better results in terms of product optimization.
What connections are there? How can the "DNA" have anything to do with the financial world? What is the Medici Effect?
The Medici Effect is the coming together of different disciplines. At this intersection of different areas, new ideas and sciences can emerge. At first glance, one might think that these areas are foreign to each other. But everyone at the intersection can benefit from the techniques and experience of others. Finding solutions together is not only easier but also faster. From an abstract perspective (philosophy and metaphysics), each participant (game theory) in the stock market has a certain intention and acts (psychology) accordingly. Before making a decision (biology and neural networks), which is individual for everyone (genes and DNA), one orients oneself to numbers, analyses, and facts (statistics) depending on the current situation (economics).
Contact
Phone:
+49 7531 58487 50
E-Mail:
Address:
Bücklestrasse 3e78467 Konstanz
Digital Platform:

Finanzhefte: